 Written by Jay Campbell


Last week I talked about how to mentally and physically prepare yourself for the coronavirus.
While world-leading researchers are still deducing its exact nature, we have a solid grasp on how it is transmitted.
We also know how the coronavirus will impact human health – starting from when you catch it to when it proves fatal.
But what’s missing in this discussion is a “bird’s eye view” of the coronavirus’ impact on the world.
If you read anything from mainstream media, it’s easy to see why society is in a perpetual state of panic and fear.
And as you already know, FEAR does not do a population well:
“To prove that they’re in control of the situation, governments are shutting off entire communities, school systems and trade routes.
With these measures they are above all spreading even more panic among the population and also perhaps standing in the way of solutions, because the pharmaceutical industry, for example, needs international trade to survive.”
Before we can begin to understand the global impact of coronavirus, we must take a few steps back and familiarize ourselves with a few concepts…
What Does Exponential Growth Really Look Like?

Physicist Al Bartlett is infamous for saying “The greatest shortcoming of the human race is the ability to understand the exponential function”.
In other words, humans are capable of thinking in linear terms but cannot fully comprehend exponential trends.
Unlike linear growth, exponential growth appears to be moving much slower until it is already too late.
The best way to demonstrate this principle in growth is through the well-known “lily pad” story.
It goes like this…
Imagine you have an empty pond, and you put in a single lily pad that grows exponentially.
This means the pond will have 2 lily pads after 1 month, 4 lily pads after 2 months, and so on.
You are told that if the lily pad continues to grow exponentially, the entire pond will be covered in 36 months.
Without pulling out a calculator or thinking for more than 5 seconds, can you tell me when the pond will be HALF full?
Think of your response and hold it tightly in your mind as you continue reading (NO CHEATING!).
At Month 30, the pond will be 1/64 full.
The instinctive response would be 18 months – right at the halfway point.
WRONG! The pond is half-filled at exactly 35 months.
This means the following and final month – Month #36 – will see the pond completely filled because the lily pad population doubles yet again.
One comment I read on the Internet summarizes the outcome of this example perfectly:
“…after waiting until [Month 35] you need to kill off half of the pond’s lily pads every day for eternity just to avoid losing the entire pond. This is the lesson of exponential growth.”
How does this relate to the coronavirus?
Many scientists are already convinced the number of coronavirus cases is presently growing at an exponential rate:
“Some scientists have estimated that the number of cases doubles about every seven days.
If you play that logic out, it is easy enough to see how people might be complacent at first, then in a few months there is a public health crisis.”
And the people who choose to remain ignorant of the coronavirus’ rapid spread can be summarized in two sentences:
“Humans (including economists) DO understand the exponential function.
The problem is they don’t think it applies to them.”
How Easy Is It To Spread The Coronavirus Around?

In order to answer this question, let’s take a few factors into consideration.
First, we already know the coronavirus is highly transmissible because it is likely contagious at a distance of two meters.
Put in easier terms to understand, it’s around 3 times your arm’s length.
Second, the coronavirus’ average fatality rate is currently 2.3% yet this changes significantly depending on which age group you are in:
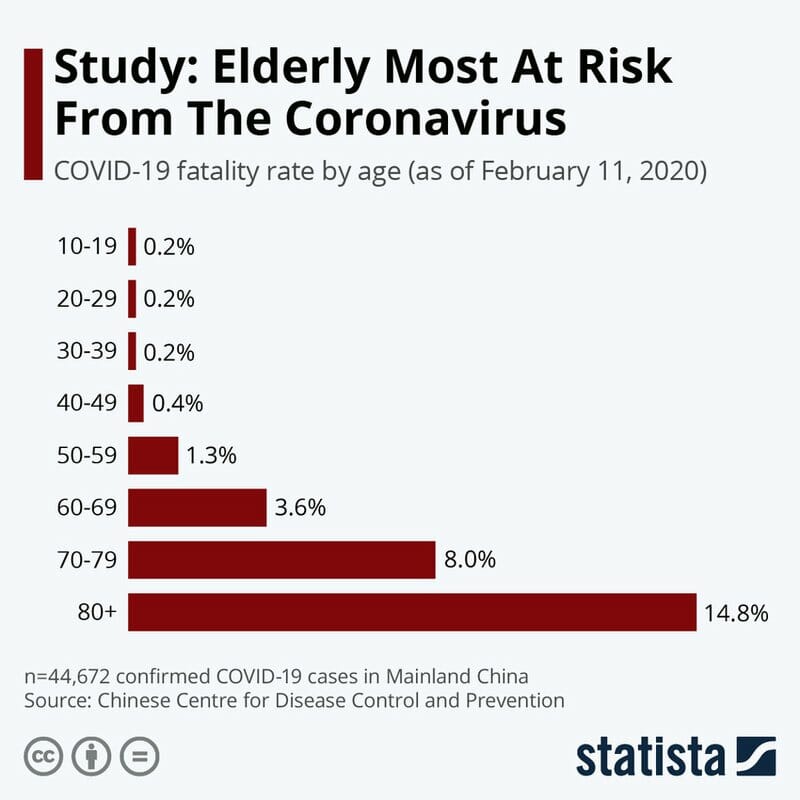
(And for the record, males have a fatality rate of 2.8% compared to 1.7% for females)
Third, we need to grasp just how fast the coronavirus is capable of spreading.
This informative graph from analytical research firm Bianco Research demonstrates the difference between its projection progression and the number of reported infections:
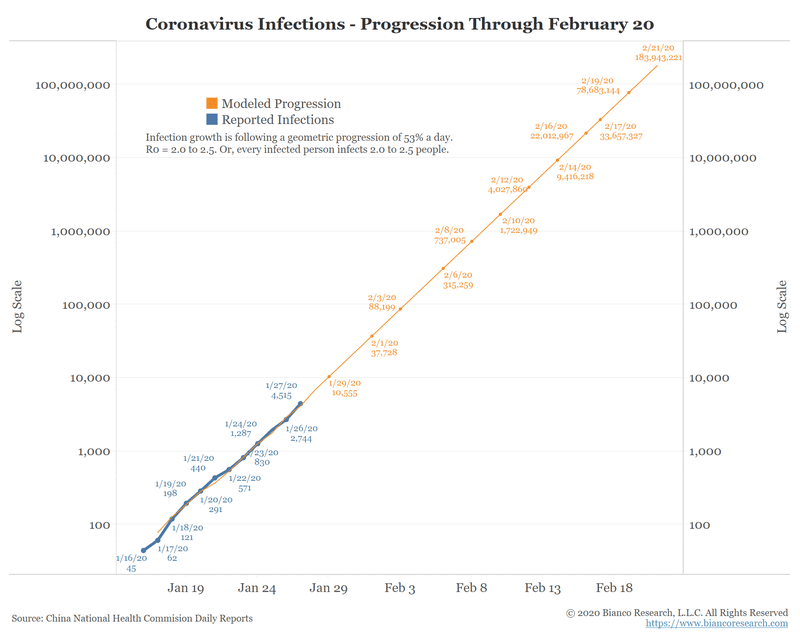
If we take the graph above at face value, this would mean roughly 138 million people were infected by February 20 (and who knows where that number is now).
Is this level of growth possible?
Absolutely – as I mentioned in last week’s blog, many people are in Stage 1 or Stage 2 of the coronavirus.
- Stage 1 = “flu-like” symptoms (2-4 days after exposure)
- Stage 2 = clinical latency, where the viral infection is progressing without the individual experiencing any symptoms (14-24 days after Stage 1)
And in case you’re wondering what “R0” meant on the graph I just showed you:
“It’s a mathematical term that indicates how contagious an infectious disease is. It’s also referred to as the reproduction number.
…R0 tells you the average number of people who will catch a disease from one contagious person.
…If a disease has an R0 of 18, a person who has the disease will transmit it to an average of 18 other people, as long as no one has been vaccinated against it or is already immune to it in their community.”
So when R0 is greater than 1, more than one new infection can be caused from the existing infection.
The graph from Bianco Research indicated an R0 value of 2.5.
This number varies wildly depending on the rate of reporting the disease:
“The early outbreak data largely follows the exponential growth.
We estimated that the mean R0 ranges from 2.24 to 3.58 associated with 8-fold to 2-fold increase in the reporting rate.
We demonstrated that changes in reporting rate substantially affect estimates of R0.”
Let’s summarize what we have up until now…
We have a disease which has a very long infectious period.
We have unknowingly infected people coming into contact with other people.
And we know the coronavirus travels through the air.
Sounds like the coronavirus is easily being spread around at an exponential rate!
(BTW – this live calculator gives you real-time updates on the numbers of cases and deaths related to the coronavirus)
Is The Coronavirus REALLY Like The Flu?!
Do NOT believe anyone who attempts to tell you the coronavirus is just like the seasonal flu.
Take a look at this graph from the CDC’s “Interim Pre-Pandemic Planning Guidance Document”:
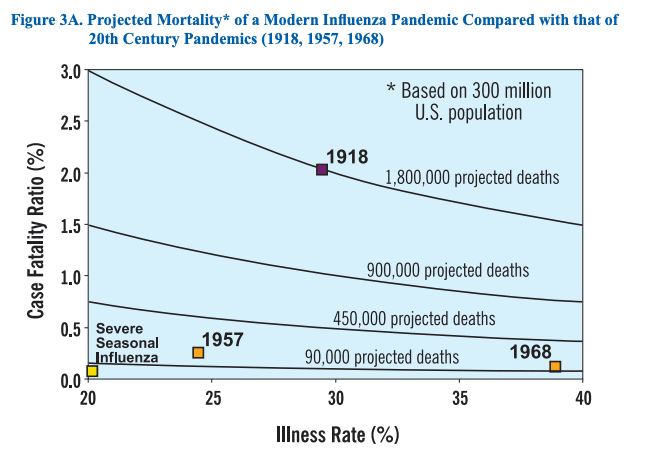
If we take the coronavirus at face value (and we already know there’s MANY more cases going unreported)…
…its projected mortality matches what was seen in The Great Spanish Flu Pandemic of 1918.
Even the circumstances match up perfectly:
- Lack of media transparency about the disease’s true nature
- Powerful people in denial who eventually get sick
- The useless attempts to wear masks in an effort to avoid infection
But here’s the really interesting part:
The 1918 pandemic was especially lethal for young adults in the 20-40 age range.
If you recall the earlier infographic showing fatality across age groups, the coronavirus is far more lethal to the elderly.
It’s those ages 60 and above (specifically those who are highly inflamed and/or immune compromised) who have a higher risk of lethal health outcomes.
The coronavirus article I wrote last week highlighted the populations who are most at risk for being infected, so you likely knew this already.
Yet I didn’t address how all age groups are secretly at risk, and you’re about to see why.
How Does The Coronavirus Impact Healthcare Services?

Think about it:
What happens when our hospitals and healthcare clinics are overwhelmed?
We lose access to medical care due to the high volume of patients, which makes everyday medical services and interventions unavailable.
When this happens, the overall mortality rate is likely to shoot way up.
Let’s run the numbers and make a few estimates to understand how the coronavirus could potentially shut down healthcare services.
If we go with the CDC’s “pre-pandemic” model, we can expect roughly 1.8 million deaths associated with coronavirus if it continues spreading at its current rate.
And at any given time, let’s assume there are 260,000 acute care / intensive care unit (ICU) beds available in the United States at any given time.
(The real number is around ~650,000, but we will continue with our estimates for this example)
Assuming a 30% infection rate based on CDC data and a 20% hospitalization rate for high-risk groups (i.e. those over 65 years old), you’d need around 3.1 MILLION beds.
This would be 12x the number of actual beds available, and 6x if you are assuming ~650,000 beds available at any time.
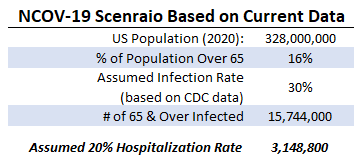
As you can see, the rate of high-risk hospitalization is the key factor here.
At our current rate we will end up massively overwhelming the available medical resources.
This means your average Joe will suffer greatly from the scarcity of medicine and lack of medical resources they have access to.
And to top it all o
f, this doesn’t even factor in the economic disruption!
Why The Coronavirus Is More Of A Pandemic Than You Think
In summation, we have a disease which poses a health risk for the entire American population (and the world population at large).
The coronavirus is a low-to-moderate risk for 70% of American citizens, and high risk for the remaining 30%.
If we’re strictly following the CDC guidelines, the coronavirus can be accurately categorized as a Category 4 or 5 pandemic:
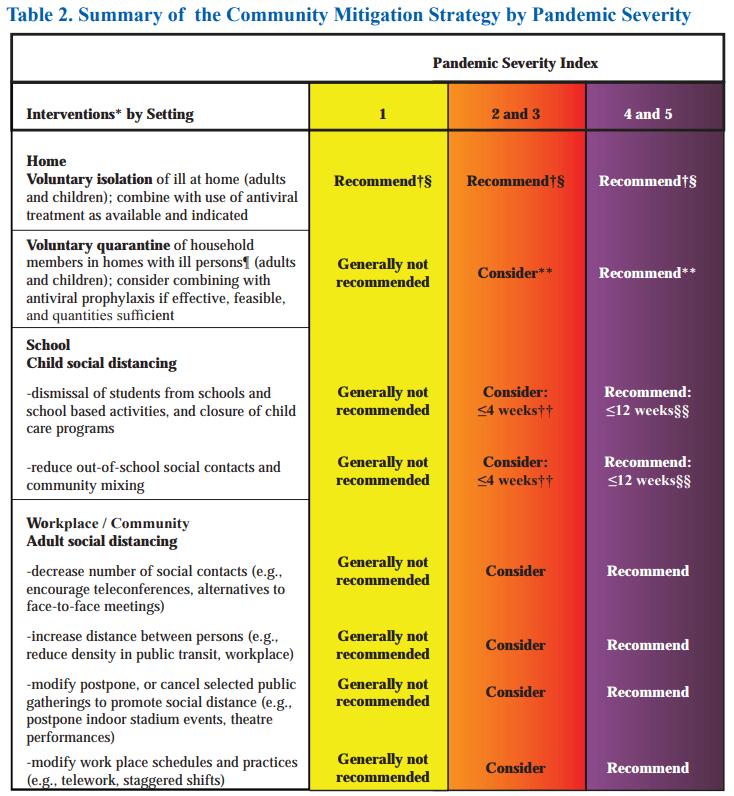
And while the CDC plan assumes no re-infection, this is certainly not the case with the coronavirus.
“People who have gotten the new coronavirus and recovered can get it again in the future, health authorities say — the body does not become immune after infection”
“For those patients who have been cured, there is a likelihood of a relapse…The antibody will be generated; however, in certain individuals, the antibody cannot last that long.”
But with all of this said, please note this article made several assumptions.
I am only giving you a very broad view of what’s going on, rather than specific forecasts.
We can only work with the case data made publicly available, but cases are under-reported globally for several reasons:
- Lack of testing
- Inconsistency with PCR results, the best screening method we have to date.
- Misidentification of the coronavirus
So what should you do?
I’m going to quote the end of last week’s article, as I believe the message still stands:
“Awareness and preparation is essential – there’s a clear difference between a complete understanding of what’s happening, and sticking your head in the sand.”
“But don’t buy into the paranoia-inducing emotions that mainstream media is shoving down your throat through clickbait articles and over-exaggerated fears.”
“Face this virus without fear and in high vibration, knowing your greatest gift is experiencing the contrast while enjoying the ride in physical form.”
I ask you to focus on remaining free of fear and worry.
Elevating your vibration through conscious words, focused thoughts and massive intentional action will keep you grounded and in a state of peace no matter what obstacles are placed in front of you.
And don’t forget to join my email list (join.totrevolution.com) for real-time updates on important health intel you need to know RIGHT NOW!